This post follows on from my May 2018 analysis of the rate of growth of my DNA matches on Ancestry between July 2017 and May 2018. I took another snapshot of all my DNA matches in August 2018. I’m interested in capturing:
- THE RATE OF GROWTH OF MATCHES
- THE DISTRIBUTION OF MATCHES BY SHARED CM
- TRENDS IN THE NUMBER OF OPT-OUTS/REMOVALS
See the earlier post for background on the technical aspects. Here I’ll just dive into the numbers.
(1) THE RATE OF GROWTH OF MATCHES
These are the total numbers at each snapshot in time: 5,100 in July 2017, 7,494 in Feb 2018, 9,026 in May 2018, and the latest number is 10,566 total matches.
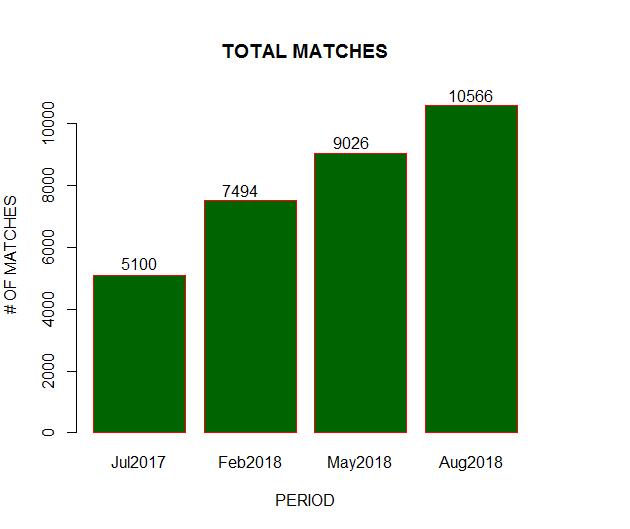
The time intervals aren’t exactly similar between Feb->May and May->August but close enough to say that the rate of growth is fairly even: 17% and 15% respectively.
(2) THE DISTRIBUTION OF MATCHES BY SHARED CM
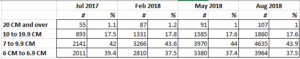
I am also interested in the number of matches broken down by CM, which Ancestry does not provide via the website. I’m going to roll up the matches into four ranges (see the same section in my July post for why I’m doing this):
6 CM to 6.9 CM
7 CM to 9.9 CM
10 CM to 19.9 CM
20 CM and over
Here are the raw numbers:
Below is a chart of the distribution. There is no change across periods, which is no great surprise. I discussed the distribution in the prior post.
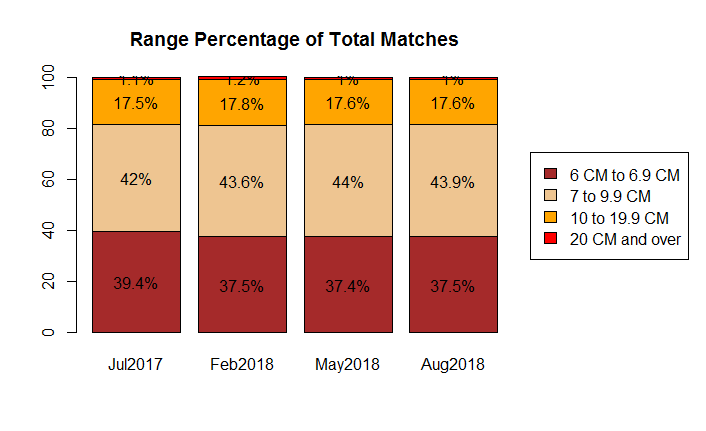
The percentages for “20 CM and above” are a little hard to read in the above graphic, because they are proportionally small. They read: 1.1%, 1.2%, 1.0%, 1.0%.
(3) TRENDS IN THE NUMBER OF OPT-OUTS/REMOVALS
In late April of this year, a wave of publicity arose from the use by the FBI of Gedmatch (a DNA matching site) to help catch the “Golden State Killer”. There’s a great round-up of links on the Cruwys blog.
There has been speculation in the DNA genealogical world that the publicity of outside agencies using our DNA might lead to people using the opt-out function in Ancestry, or remove their DNA entirely. I have no accurate way of measuring opt-out rates using snapshots in time, as I can’t capture new testers who immediately opt out. But I’ll take a look at the figures I have to hand.
My May snapshot was taken mid-month, and in a prior post on Ancestry opt-outs I noted that two matches disappeared between my February and May snapshots. Before that, five matches had disappeared some time between July 2017 and February 2018.
Between Mid-May and Mid-August, a total of 9 matches have disappered from my list. Just to be clear, these are matches that were present in mid May and are no longer available to me. I have no way of measuring matches who signed up in June and opted out in July or on the day their results came through.
Of these nine people, three had linked their DNA to family trees so its a pity to lose them. You’d think this trio weren’t people who were only interested in ethnic heritage and hadn’t realized that matching existed.
So 9 losses in the past three months is of course more than 2 in the prior three months. Not enough to worry me, but I’ll be keeping an eye on the numbers.
1 thought on “August 2018 Analysis of Growth of Matches on AncestryDNA”